

In the last article, we talked about how to understand the basics of reading the speed trace. It’s a quick a easy way to see when and where you’re picking up speed and decelerating. Now what we want to do is dig a big deeper and see what understanding we can uncover from the speed trace between different laps.
Now, before we go any farther, I want to make it clear that the information that we uncover with just one channel isn’t the end all. Typically, it’s best to read into other channels to really verify what we think it happening. (RPM, Lateral G, Axle speed, etc.) The more elements of data that we can peel back, the more we can use the determine the cause of what’s happening.
However, we want to start these articles by working with one channel at a time, so it’s easier to understand, so we’ll just get nice and cozy with understanding the speed trace first.
In the last article, I showed you a single lap of one of my local tracks. By looking at the slopes of the trace line, we can see how fast I was traveling in each corner, and also start to get a sense of the rate of acceleration and deceleration. However, without anything to compare it to, it’s just general data from a single lap, so we’re limited in some of the things that we can see.
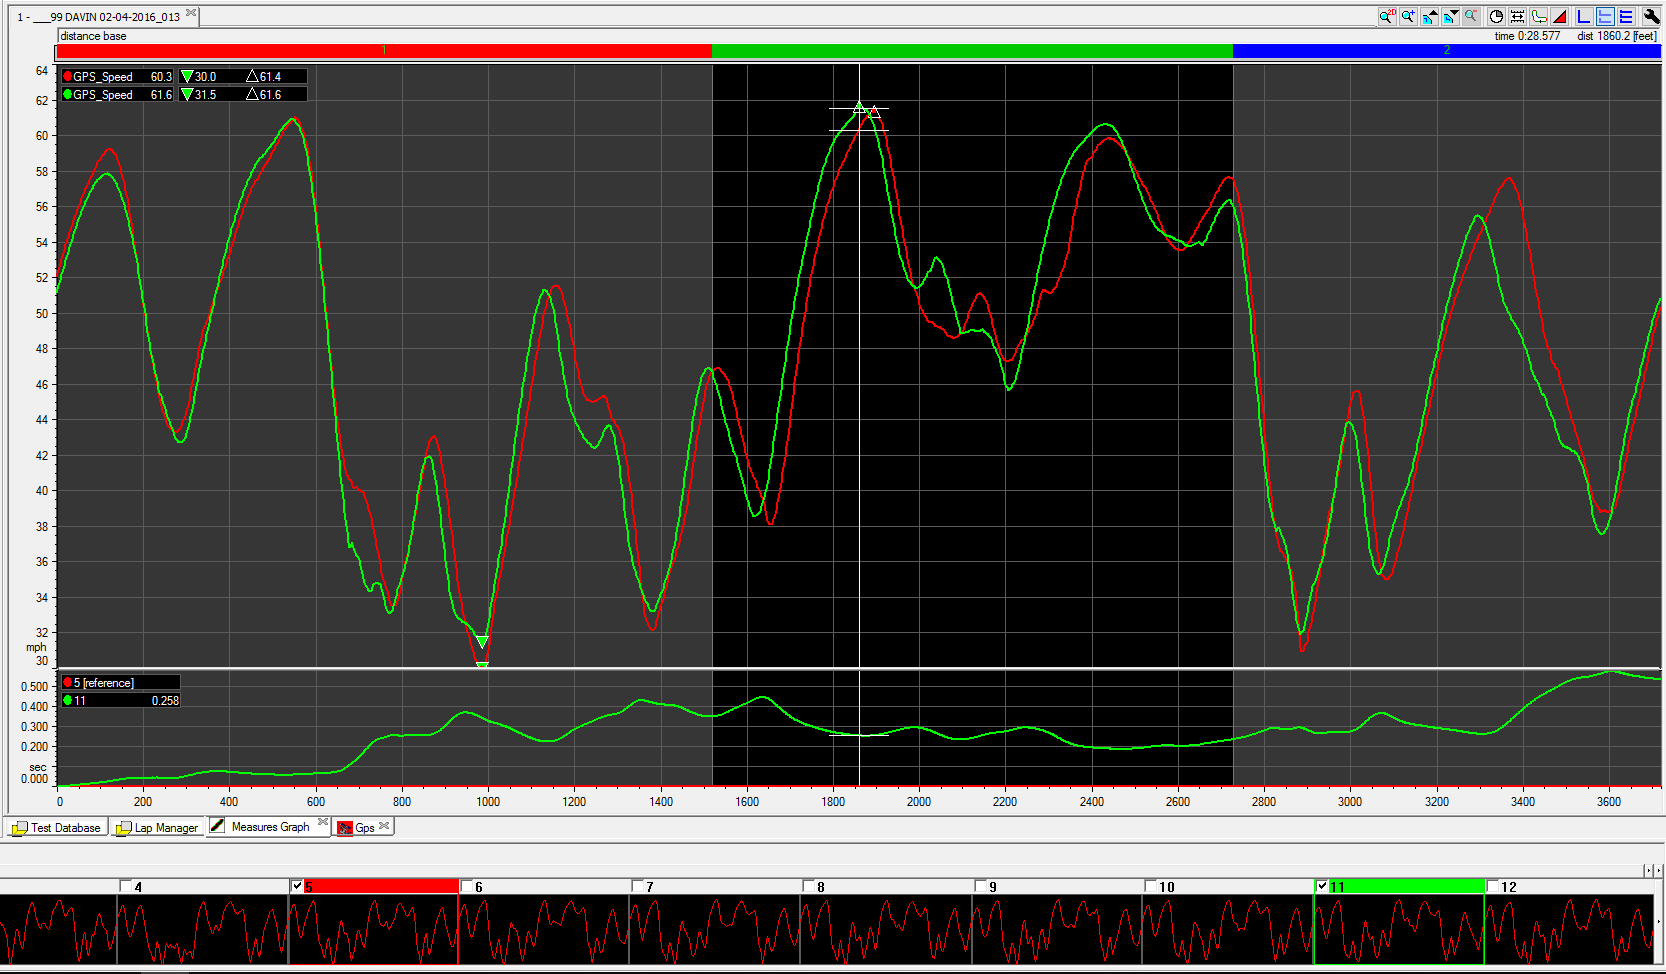
In this screenshot, I’ve overlaid the GPS speed trace from the fastest lap (red line) in the session to the slowest one (green line). If you look at what’s on the X-axis, you can see the distance that I’ve traveled when the event has happened. On the Y-Axis, you can see the speed that I’m traveling. The end difference between the two laps is a half of a second. However, if we look at the difference between the speed traces, we can start to see some of the things that are happening.
What we're basically doing here is comparing the behavior of two lines. By seeing one the slower lap does in the relation to the faster lap, we can start to determine the what, when and why that things are happening. Please, please remember that not just one channel will give you the answer to all of your problems. Many times, you can get misled if you only look at one channel. However,for the sake of getting started, we're just going to look at the speed trace.

The first thing that you can start to look at, are the places where the speed traces diverge the most from one another. There are several places between the two laps where that happens, but I’ve highlighted some of the areas that stand out the most.

Let’s zoom in on one section of the trace, and see what we can start to pick up. In the screenshot above, I’ve zoomed in on my braking into Turn 2. As you can see, the green line (slower lap) starts to drop off much sooner than the red one, and at a much sharper rate. That means that I started to decelerate much earlier that lap, and most likely (guessing without looking at other channels) with more braking pressure.
The other thing that stands out is the tiny rise of the green line, just before the slope starts to change direction. That means that I started to speed up slightly, and then started to slow down again before I truly started to accelerate from the corner. (The challenge with just looking at only the speed channel, is that there are several things that could have happened to show this in the trace data.) However, when comparing it with the red line where I’m moving much faster at the same point on the track, you could guesstimate that I overslowed going into the corner, got back on the power quickly in a rush and then got back off again before exiting the corner.
(Again, looking at other channels like RPM and Long G would really get uncover more information, but for right now, we’re just looking at speed.)

We can use the Time Compare function in Race Studio to look at the difference in laptime between the green and the red laps, we can start to see that’s where the loss of laptime starts to come from at the beginning of the lap in Turn 2. By entering the corner too slowly, I’ve given up .2 between the slower lap and the faster one. That time loss starts to increase as I accelerate out of the corner, as I’m accelerating slower out of the corner.
So what does that tell me? Well just as a general point, I should look at my braking into Turn 2 as a place to start. I’ll have to do more investigation, but the general point is find a point where I can start to slow down, where I can carry a higher minimum speed on the approach to the corner. I’ll need to take a look at some other channels to really see where in the deceleration the issue really comes from, but this show we can use the speed trace as a place to start.
Now what we should do next is take a look at other laps, and see if we can find some trending in what I’m doing in each lap. (Look at each lap one at a time, so you don't confuse your brain with too many squiggly lines.) First, we can look to see if there are areas where there are abnormalities each lap, where I’m not doing the same thing each lap. Second, we can work to identify if there are any outliers where I’ve done something different, where I’ve gained time back compared to the other laps. By taking what I’ve see and compare to other laps, I can start to get more confidence if the change my driving that I’m planning to make will be more likely to be noticed.
Look back at the shot of the entire lap above, and compare the two traces. Try to see if you can determine what’s happening to the driver on the green lap, compared to the red one.
***


FB Comments